Glossary term
Glossary term
Foundations
A metric representing a model's loss during a particular training iteration. For example, suppose the loss function is Mean Squared Error. Perhaps the training loss (the Mean Squared Error) for the 10th iteration is 2.2, and the training loss for the 100th iteration is 1.9.
A loss curve plots training loss versus the number of iterations. A loss curve provides the following hints about training:
A downward slope implies that the model is improving.
An upward slope implies that the model is getting worse.
A flat slope implies that the model has reached convergence.
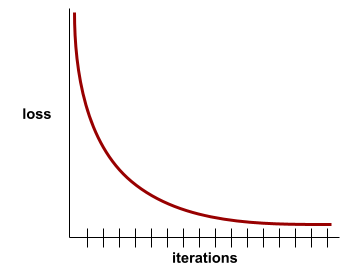
For example, the following somewhat idealized loss curve shows:
A steep downward slope during the initial iterations, which implies rapid model improvement.
A gradually flattening (but still downward) slope until close to the end of training, which implies continued model improvement at a somewhat slower pace then during the initial iterations.
A flat slope towards the end of training, which suggests convergence.
Although training loss is important, see also generalization.
For example, the following somewhat idealized loss curve shows:
A steep downward slope during the initial iterations, which implies rapid model improvement.
A gradually flattening (but still downward) slope until close to the end of training, which implies continued model improvement at a somewhat slower pace then during the initial iterations.
Created for this library
An ML team monitors training loss curves to spot convergence issues early in long training runs.
A research team compares training loss across hyperparameter sweeps to find a stable configuration for a new architecture.
An ML platform team includes training loss in every release review alongside validation and test metrics.
Definition source: Google for Developers Machine Learning Glossary | Creative Commons Attribution 4.0 License