Glossary term
Glossary term
Foundations
A graph of true positive rate versus false positive rate for different classification thresholds in binary classification.
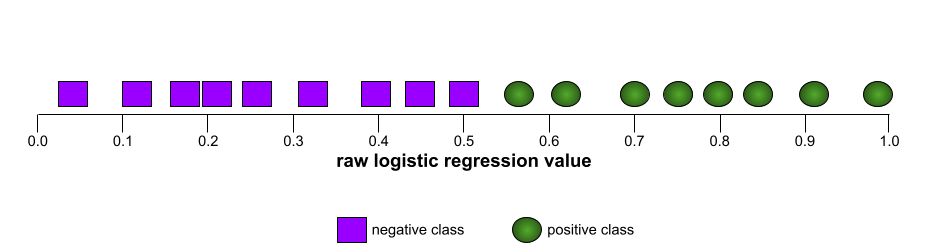
The shape of an ROC curve suggests a binary classification model's ability to separate positive classes from negative classes. Suppose, for example, that a binary classification model perfectly separates all the negative classes from all the positive classes:
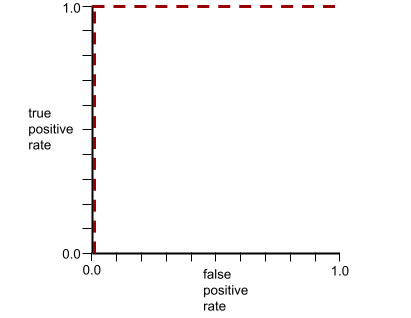
The ROC curve for the preceding model looks as follows:
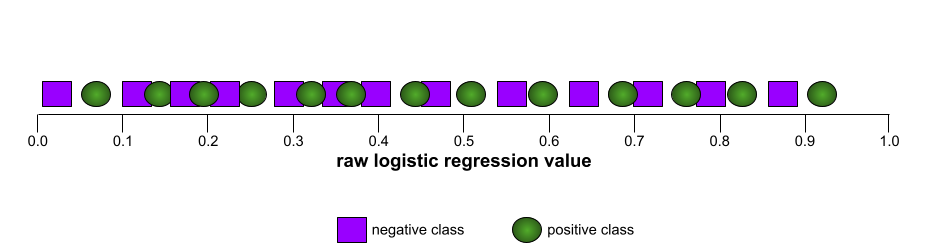
In contrast, the following illustration graphs the raw logistic regression values for a terrible model that can't separate negative classes from positive classes at all:
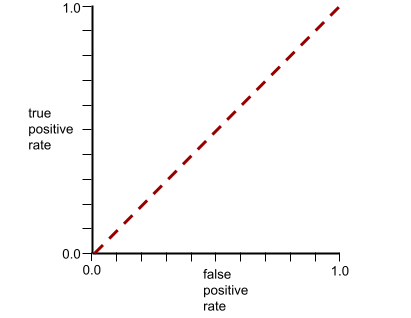
The ROC curve for this model looks as follows:
Meanwhile, back in the real world, most binary classification models separate positive and negative classes to some degree, but usually not perfectly. So, a typical ROC curve falls somewhere between the two extremes:
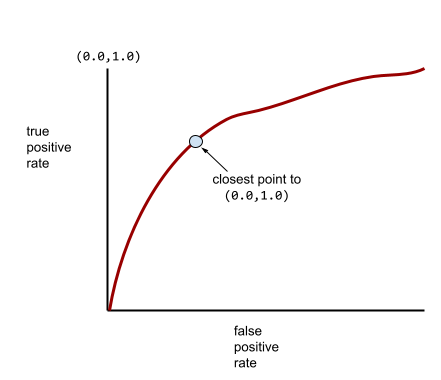
The point on an ROC curve closest to (0.0,1.0) theoretically identifies the ideal classification threshold. However, several other real-world issues influence the selection of the ideal classification threshold. For example, perhaps false negatives cause far more pain than false positives.
A numerical metric called AUC summarizes the ROC curve into a single floating-point value.
Created for this library
A bank's credit team plots the ROC curve to choose an operating threshold that balances false positives against false negatives.
A medical screening team uses the ROC curve to evaluate diagnostic models across operating points before clinical sign-off.
A fraud team uses the ROC curve in its monthly review to track trade-off shifts after each model update.
Definition source: Google for Developers Machine Learning Glossary | Creative Commons Attribution 4.0 License