Glossary term
Glossary term
Evaluation and Benchmarks
The frequency and range of different values for a given feature or label. A distribution captures how likely a particular value is.
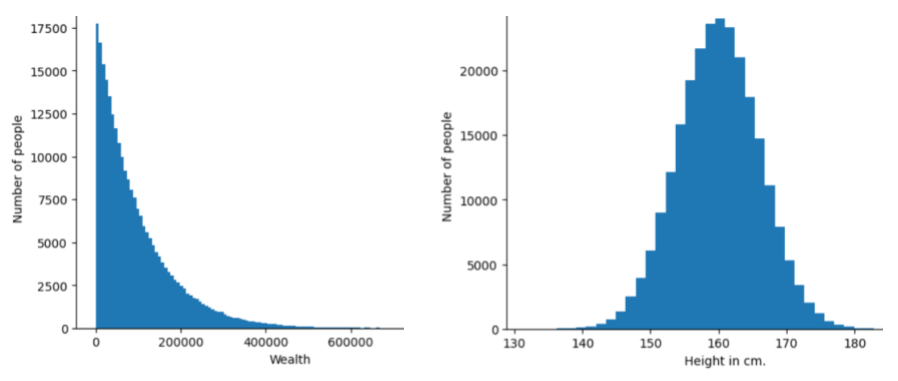
The following image shows histograms of two different distributions:
On the left, a power law distribution of wealth versus the number of people possessing that wealth.
On the right, a normal distribution of height versus the number of people possessing that height.
Understanding each feature and label's distribution can help you determine how to normalize values and detect outliers.
The phrase out of distribution refers to a value that doesn't appear in the dataset or is very rare. For example, an image of the planet Saturn would be considered out of distribution for a dataset consisting of cat images.
Created for this library
A risk team checks the distribution of incoming applications each week so it can detect upstream changes that may affect its model.
A retail demand team monitors the distribution of sales by region to detect markets where its model is starting to drift.
A churn team plots the distribution of model scores monthly to confirm the production model is still calibrated to recent customer behavior.
Definition source: Google for Developers Machine Learning Glossary | Creative Commons Attribution 4.0 License